Business intelligence (BI) is a process
for analyzing data and presenting actionable information to help corporate
executives, business managers and other end users make more informed business
decisions.
Figure: Business Intelligence Process
BI encompasses a variety of tools,
applications and methodologies that enable organizations to collect data from
internal systems and external sources using SQL Server Integration Service
(SSIS) and Extract Load and Transform (ETL) process, prepare it for analysis
using SQL Server Analysis Service (SSAS), develop and run queries against the
data, and create reports using SQL Server Reporting Service (SSRS), dashboards
and data visualizations to make the analytical results available to corporate
decision makers as well as operational workers.
The potential benefits of business intelligence programs include accelerating and improving decision making; optimizing internal business processes; increasing operational efficiency; driving new revenues; and gaining competitive advantages over business rivals. BI systems can also help companies identify market trends and spot business problems that need to be addressed.
The first
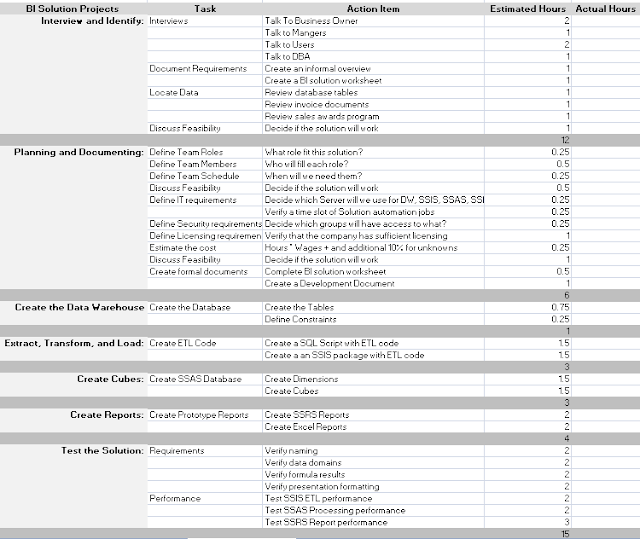
step in designing Business Intelligence solution is Planning phase where BI
Consultants and Managers fills up the BI planning worksheet including the
information about Roles, Solution Schedule, Estimated hours etc.
The
planning phase starts with the interview, documenting the requirements,
locating different data sources and data, deciding on teams and roles, timelines for each and every step of
planning, scheduling the BI plan, Deciding on nice to have data, must have
features and not important information, scope of the requirement, deciding on
achievable and non-achievable goals, user training etc.
There are 7 important points any company should consider before they go for BI Solution design to have effective solution for their organization and they are,
- Storage and computing hardware: Firms will need to invest or upgrade their data storage infrastructure.
- Applications and data sources: Source data will need to be scrubbed and organized.
- Data integration : Firms will need to invest in middle ware "connectors" to allow data from source applications to be integrated with the BI repository.
- OLAP applications and analytic engines: OLAP provide a layer of separation between the storage repository and the end user's analytic application and it performs special analytical functions that require high-performance processing power.
- Analytic applications: Analytic applications are the programs used to run queries against the data to perform "drill-down" analysis.
- Information presentation and delivery products: enterprises can purchase packaged or custom reporting products, such as Crystal Reports or leverage XML to deliver analyses through a portal or any other Internet-enabled interface for example PDA.
After
requirement gathering and collecting source data through interviews and other
resources, the next step is design a Data Warehouse and tables.
One can
design Data Warehouse in either Star Schema (data in non normalized form,
speedy performance in querying data) or Snowflake schema (normalized form) or
hybrid of both the design schema. Both schema use Fact and Dimension
tables.
Fact
tables references to dimensions and contains additive, non additive or
calculated measures.
Dimension
tables stores attributes or dimensions that describes objects in fact table.
Ice Cream
Company Sales Data: Building Data Warehouse
IF EXISTS (SELECT *FROM sys.sysdatabases WHERE name = 'SalesIceCream_DW')
BEGIN
DROP DATABASE
SalesIceCream_DW
END
GO
-- CREATE A DATABASE
Create database
SalesIceCream_DW
Go
-- CREATE DIMENSION TABLES
Use SalesIceCream_DW
GO
CREATE TABLE DimFlavor
(FlavorKey int identity NOT NULL PRIMARY KEY NONCLUSTERED,
FlavorAltKey
nvarchar(10) NOT NULL,
FlavorName nvarchar(50) NULL,
FlavorCategoryName nvarchar(50))
Go
CREATE TABLE DimToppings
(ToppingsKey int identity NOT NULL PRIMARY KEY NONCLUSTERED,
ToppingsAltKey nvarchar(10) NOT NULL,
ToppingsName nvarchar(50) NULL,
ToppingsCategoryName nvarchar(50))
GO
CREATE TABLE DimCustomer
(CustomerKey int identity NOT NULL PRIMARY KEY NONCLUSTERED,
CustomerAltKey nvarchar(10) NOT NULL,
CustomerName nvarchar(50) NULL,
CustomerGender nvarchar(10) NULL)
GO
CREATE TABLE DimDate
(DateKey int
NOT NULL PRIMARY KEY NONCLUSTERED,
DateAltKey datetime NOT NULL,
CalendarYear int NOT NULL,
CalendarQuarter int NOT NULL,
MonthOfYear
int NOT NULL,
[MonthName]
nvarchar(15) NOT NULL,
[DayOfMonth] int NOT NULL,
[DayOfWeek]
int NOT NULL,
[DayName] nvarchar(15) NOT NULL,
FiscalYear int NOT NULL,
FiscalQuarter int NOT NULL)
GO
CREATE TABLE
FactSalesOrder
(FlavorKey int NOT NULL REFERENCES DimFlavor(FlavorKey),
ToppingsKey int NOT NULL REFERENCES DimToppings(ToppingsKey),
CustomerKey int NOT NULL REFERENCES DimCustomer(CustomerKey),
OrderDateKey int NOT NULL REFERENCES DimDate(DateKey),
OrderNo int NOT NULL,
ItemNo int NOT NULL,
Quantity int NOT NULL,
Price money NOT NULL,
SalesAmount money NOT NULL
CONSTRAINT [PK_FactSalesOrder] PRIMARY KEY NONCLUSTERED
(
[FlavorKey],[ToppingsKey],[CustomerKey],[OrderDateKey],[OrderNo],[ItemNo]
)
)
GO
CREATE TABLE DimStore
(StoreKey int
identity NOT NULL PRIMARY KEY NONCLUSTERED,
PostalCode nvarchar(15) NULL,
City nvarchar(50) NULL,)
GO
-- POPULATE THE TIME DIMENSION TABLE
DECLARE @StartDate datetime
DECLARE @EndDate datetime
SET @StartDate = '01/01/2011'
SET @EndDate = getdate()
DECLARE @LoopDate datetime
SET @LoopDate = @StartDate
WHILE @LoopDate <= @EndDate
BEGIN
INSERT INTO dbo.DimDate VALUES
(
CAST(CONVERT(VARCHAR(8), @LoopDate, 112) AS int) , -- date key
@LoopDate, -- date alt key
Year(@LoopDate), -- calendar year
datepart(qq, @LoopDate), -- calendar quarter
Month(@LoopDate), -- month number of year
datename(mm, @LoopDate), -- month name
Day(@LoopDate), -- day number of month
datepart(dw, @LoopDate), -- day number of week
datename(dw, @LoopDate), -- day name of week
CASE
WHEN Month(@LoopDate) < 7 THEN Year(@LoopDate)
ELSE Year(@Loopdate) + 1
END, -- Fiscal year (assuming
fiscal year runs from Jul to June)
CASE
WHEN Month(@LoopDate) IN (1, 2, 3) THEN 3
WHEN Month(@LoopDate) IN (4, 5, 6) THEN 4
WHEN Month(@LoopDate) IN (7, 8, 9) THEN 1
WHEN Month(@LoopDate) IN (10, 11, 12) THEN 2
END -- fiscal quarter
)
SET @LoopDate = DateAdd(dd, 1, @LoopDate)
Create Database:
Create Dimension Table:
Create Fact Table and create relation between Fact Table and
Dimension Table:
Data
Warehouse Diagram ( Snowflake Schema)
Last but
not least we add all the planning documents including BIsolutionPlan.docx and
BISolutionWorksheet.xlsx documents to the Solution folder in Visual Studio
2013.
Here we
complete the data warehouse design and planning.


No comments:
Post a Comment